My name is Alisa, and I'm an Android engineer at Pinterest! I graduated from MIT in June 2019 with B.S. and M.Eng in Computer Science with a minor in Design.
I especially enjoy working on web and mobile applications and anything frontend. I previously interned at Facebook and Pinterest, competed in hackathons, and worked on Replot, a data visualization library, as my undergraduate research project. Check out my resume for more!
In summer 2016, I fell in love with pole fitness, and I've been pole dancing for fun ever since. When I'm not coding or pole dancing, you'll find me trying out new workouts, traveling, or chasing after cute dogs on the street.
Some of my favorite coding and design projects ❤


Website: replot.io
Source: github.com/replot
Built with: JavaScript, React.js
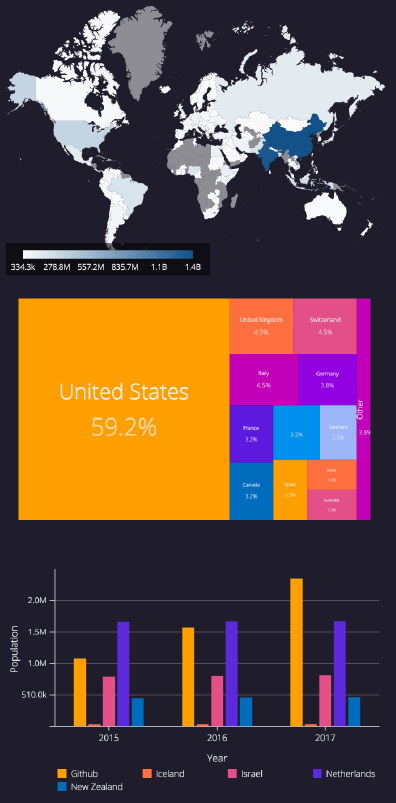
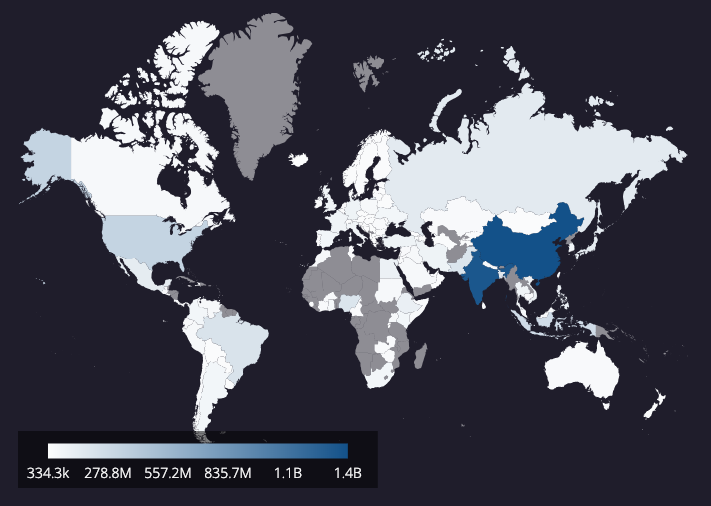
Replot is an intelligent and responsive web data visualization library built with React.js. This open source project was started in hope of solving compatibility issues between React.js and D3.js. Replot supports 8 chart types - map, tree map, bar, grouped bar, line, scatter, box plot, and network - and offers a suite of customization options.
I started working on Replot as an undergraduate research project at MIT Media Lab Collaborative Learning Group in 2017. I contributed mostly to the map, bar chart, network chart, common features like tooltips, and the official Replot website. Currently I am maintaining the codebase as a side project.
Website: desolate-ridge-53183.herokuapp.com
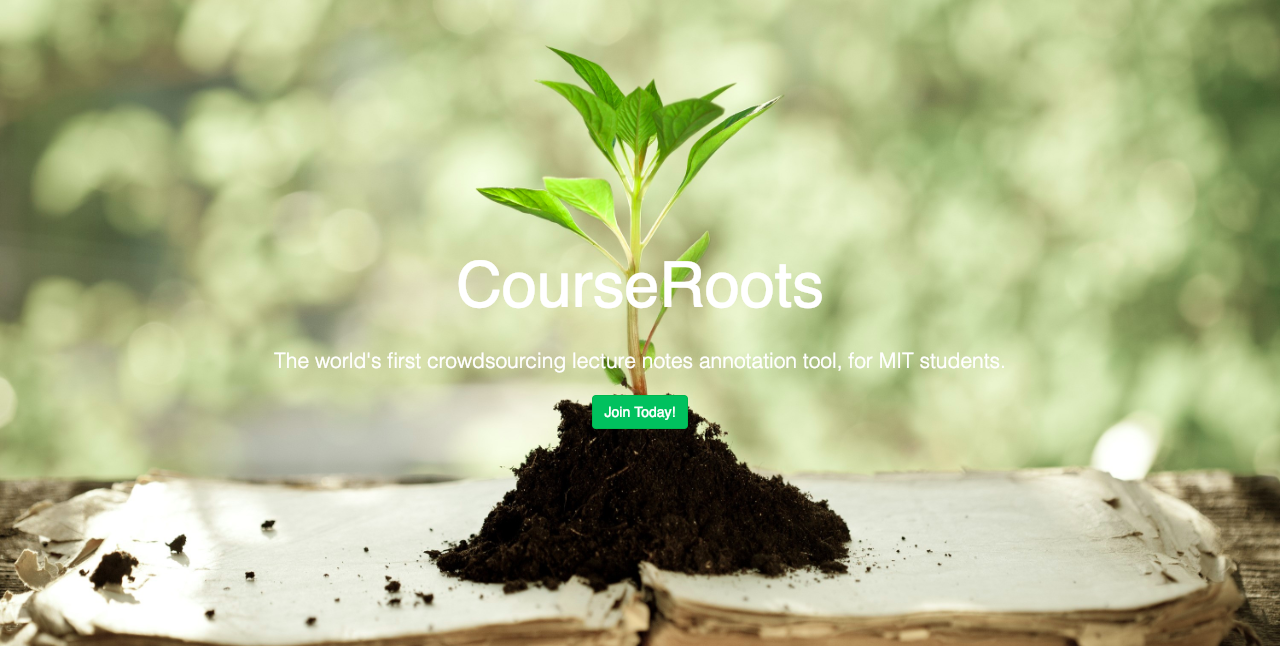
Source: github.com/alisaono/CourseRoots
Built with: JavaScript, HTML/CSS, Node.js, Firebase, Heroku
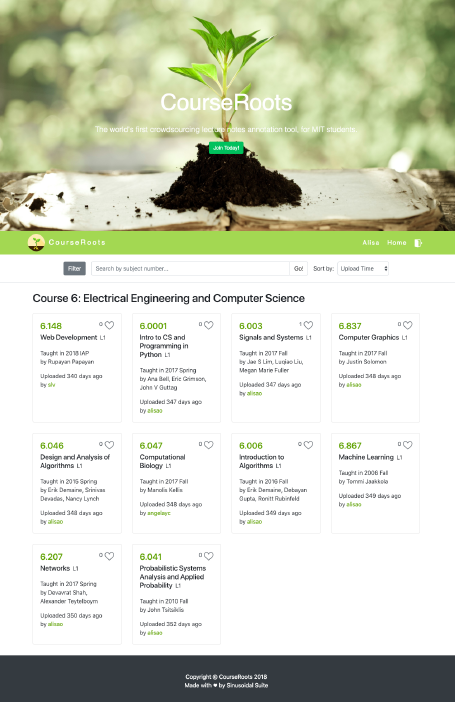
CourseRoots is a collaborative lecture note annotation platform for MIT students. Students use their MIT certificates to log in, upload their own or browse other students’ notes, and add annotations by pinning comments to specific locations on the notes. Other features include searching for notes by department, subject number, etc. and bookmarking favorite notes.
I worked on CourseRoots with two teammates during the 2018 Web Programming Competition (6.148) at MIT and won 4th place. I built the frontend main, search, and profile pages with HTML/CSS and JavaScript and the backend API with Node.js.
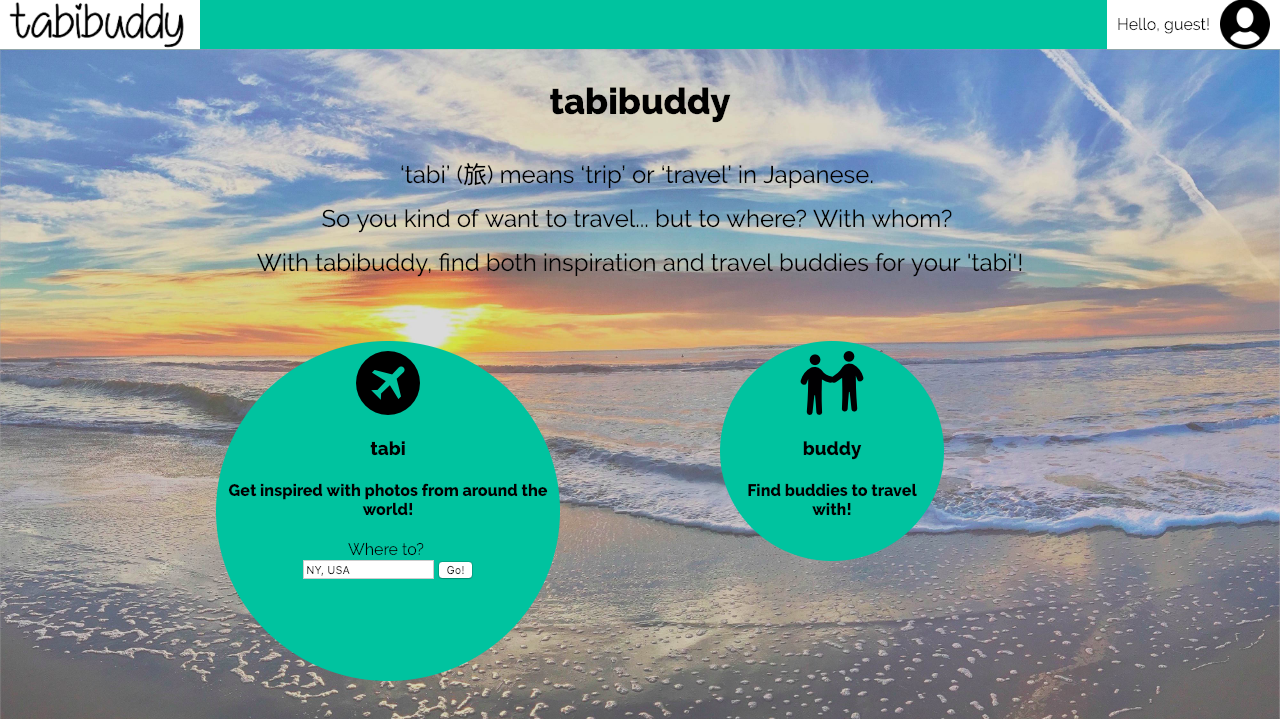
Source: github.com/alisaono/tabibuddy
Built with: JavaScript, HTML/CSS, Node.js, MongoDB, Azure
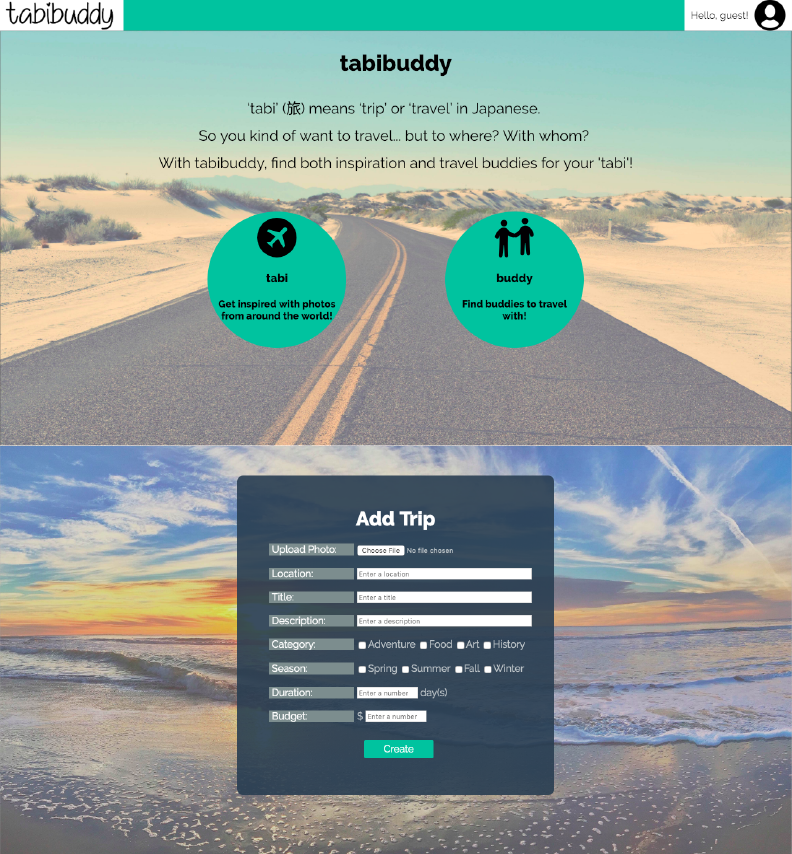
Tabibuddy is a social platform where those who love to travel share photos from their trips along with captions and details such as locations, budget, etc. Aspiring travelers can browse and bookmark other users’ photos to get inspirations for their future trips. They can also search for other users with similar interests to find their future trip buddies.
I worked on Tabibuddy with two teammates during the 2017 Web Programming Competition (6.148) at MIT. I wrote most of the frontend code and some of the backend server code. Tabibuddy was my first full-stack project :)
Source: github.com/alisaono/foda
Built with: Java, XML
Foda is an Android app that detects Latin based words in images and provides their English translations along with the top Google Image search results for these words. We used Google Vision API for words-in-image detections, Google Translate and Google Image APIs for translations and images.
I worked on Foda with three teammates during the 2017 Hack@Brown. I mostly implemented the words-in-image-detections and translations. Foda was my first Android project :)
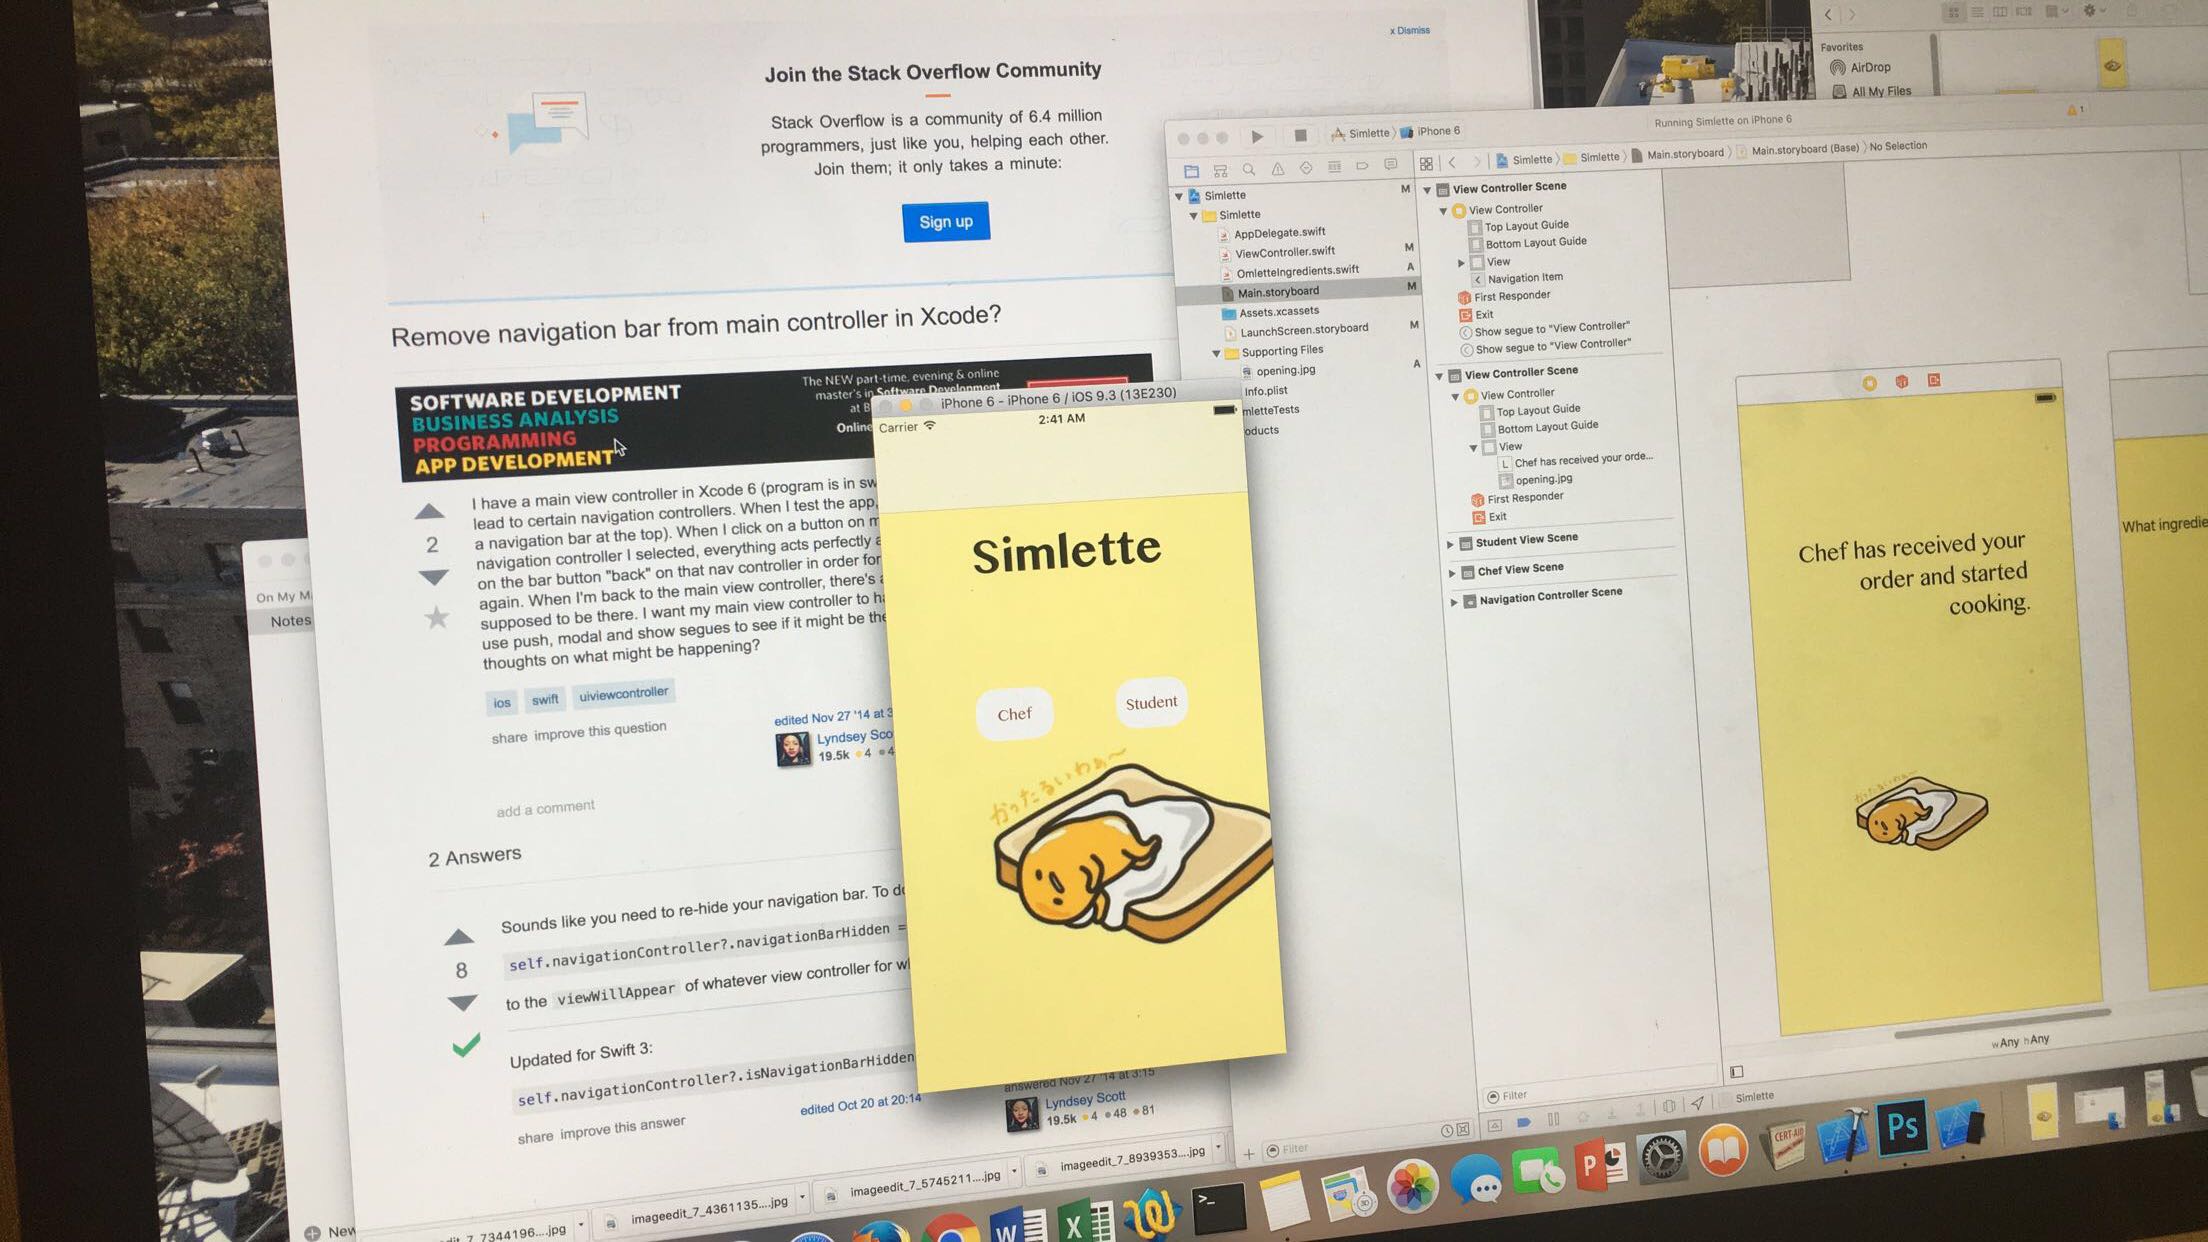
Source: github.com/alisaono/simlette
Built with: Swift
Simelette is an iOS app for residents to pre-order dining hall omelets and reduce wait time in long lines. I worked on Simelette with two teammates during the 2016 Simmons Hall Hackathon and won 3rd place. We decided to create this app because made-to-order omelets are really popular at the Simmons Hall’s dining!
Similette was my first iOS and also my first hackathon project :)
Source: github.com/alisaono/MIT-4032
Built with: JavaScript, HTML/CSS, P5.js, D3.js
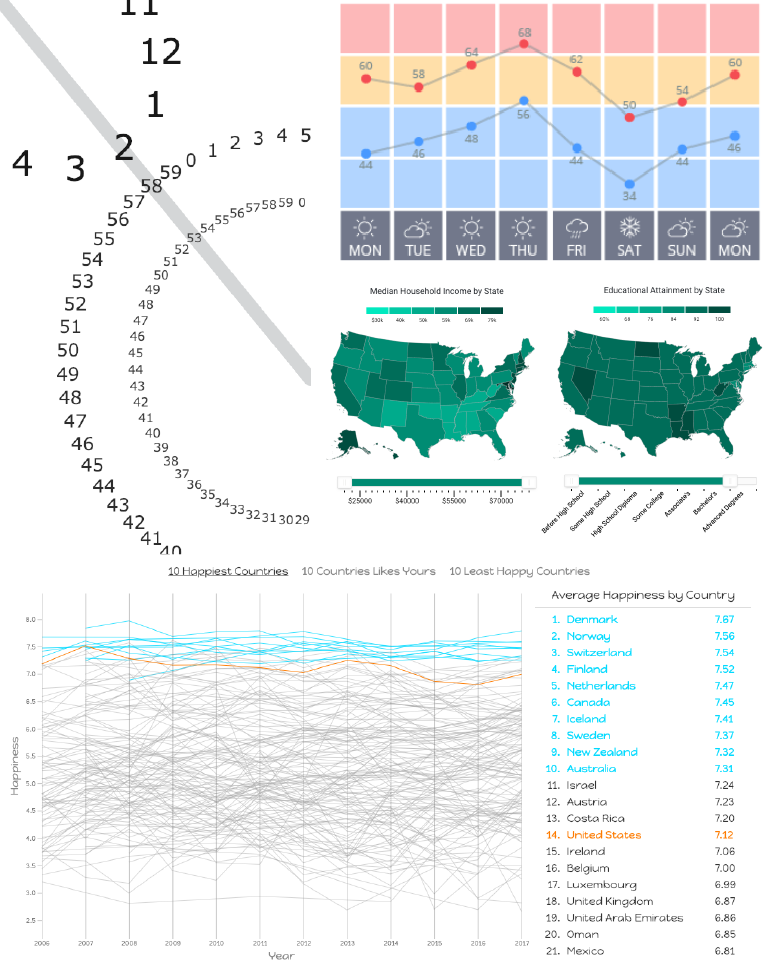
I worked on four data visualization projects while taking 4.032 (Data Visualization) in the Spring 2018.
First Project - Visualizing Time: I created three different visualizations of time using P5.js.
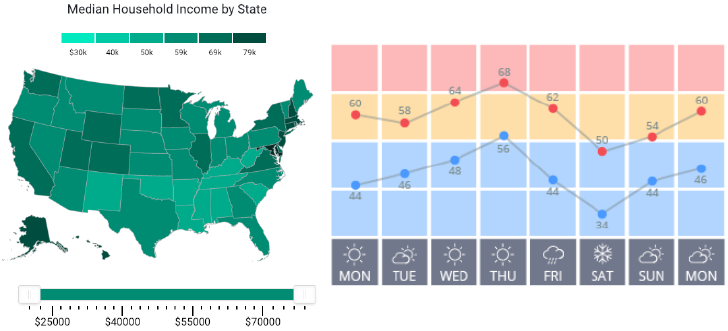
Second Project - Visualizing Weather: I created three different visualizations of real-time weather information using D3.js.
Third Project - Income and Education: I worked with three teammates to create visualizations exploring the relationships between income and education levels in the U.S. I built the map charts using D3.js.
Forth Project - Happiness around the World: I worked with two teammates to create an interactive guide through the results of Gallup World Poll’s World Happiness Report. I built the line chart using D3.js and contributed to the overall UI/UX design,
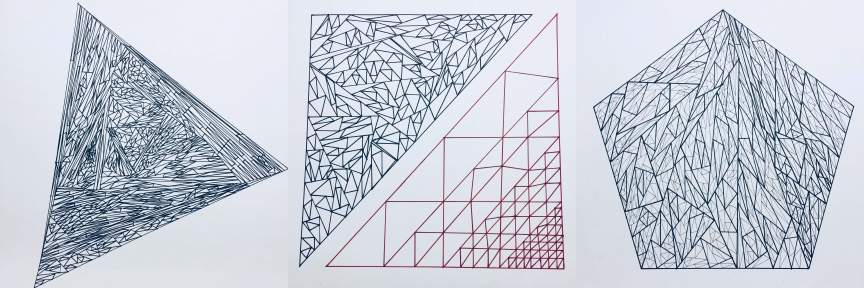
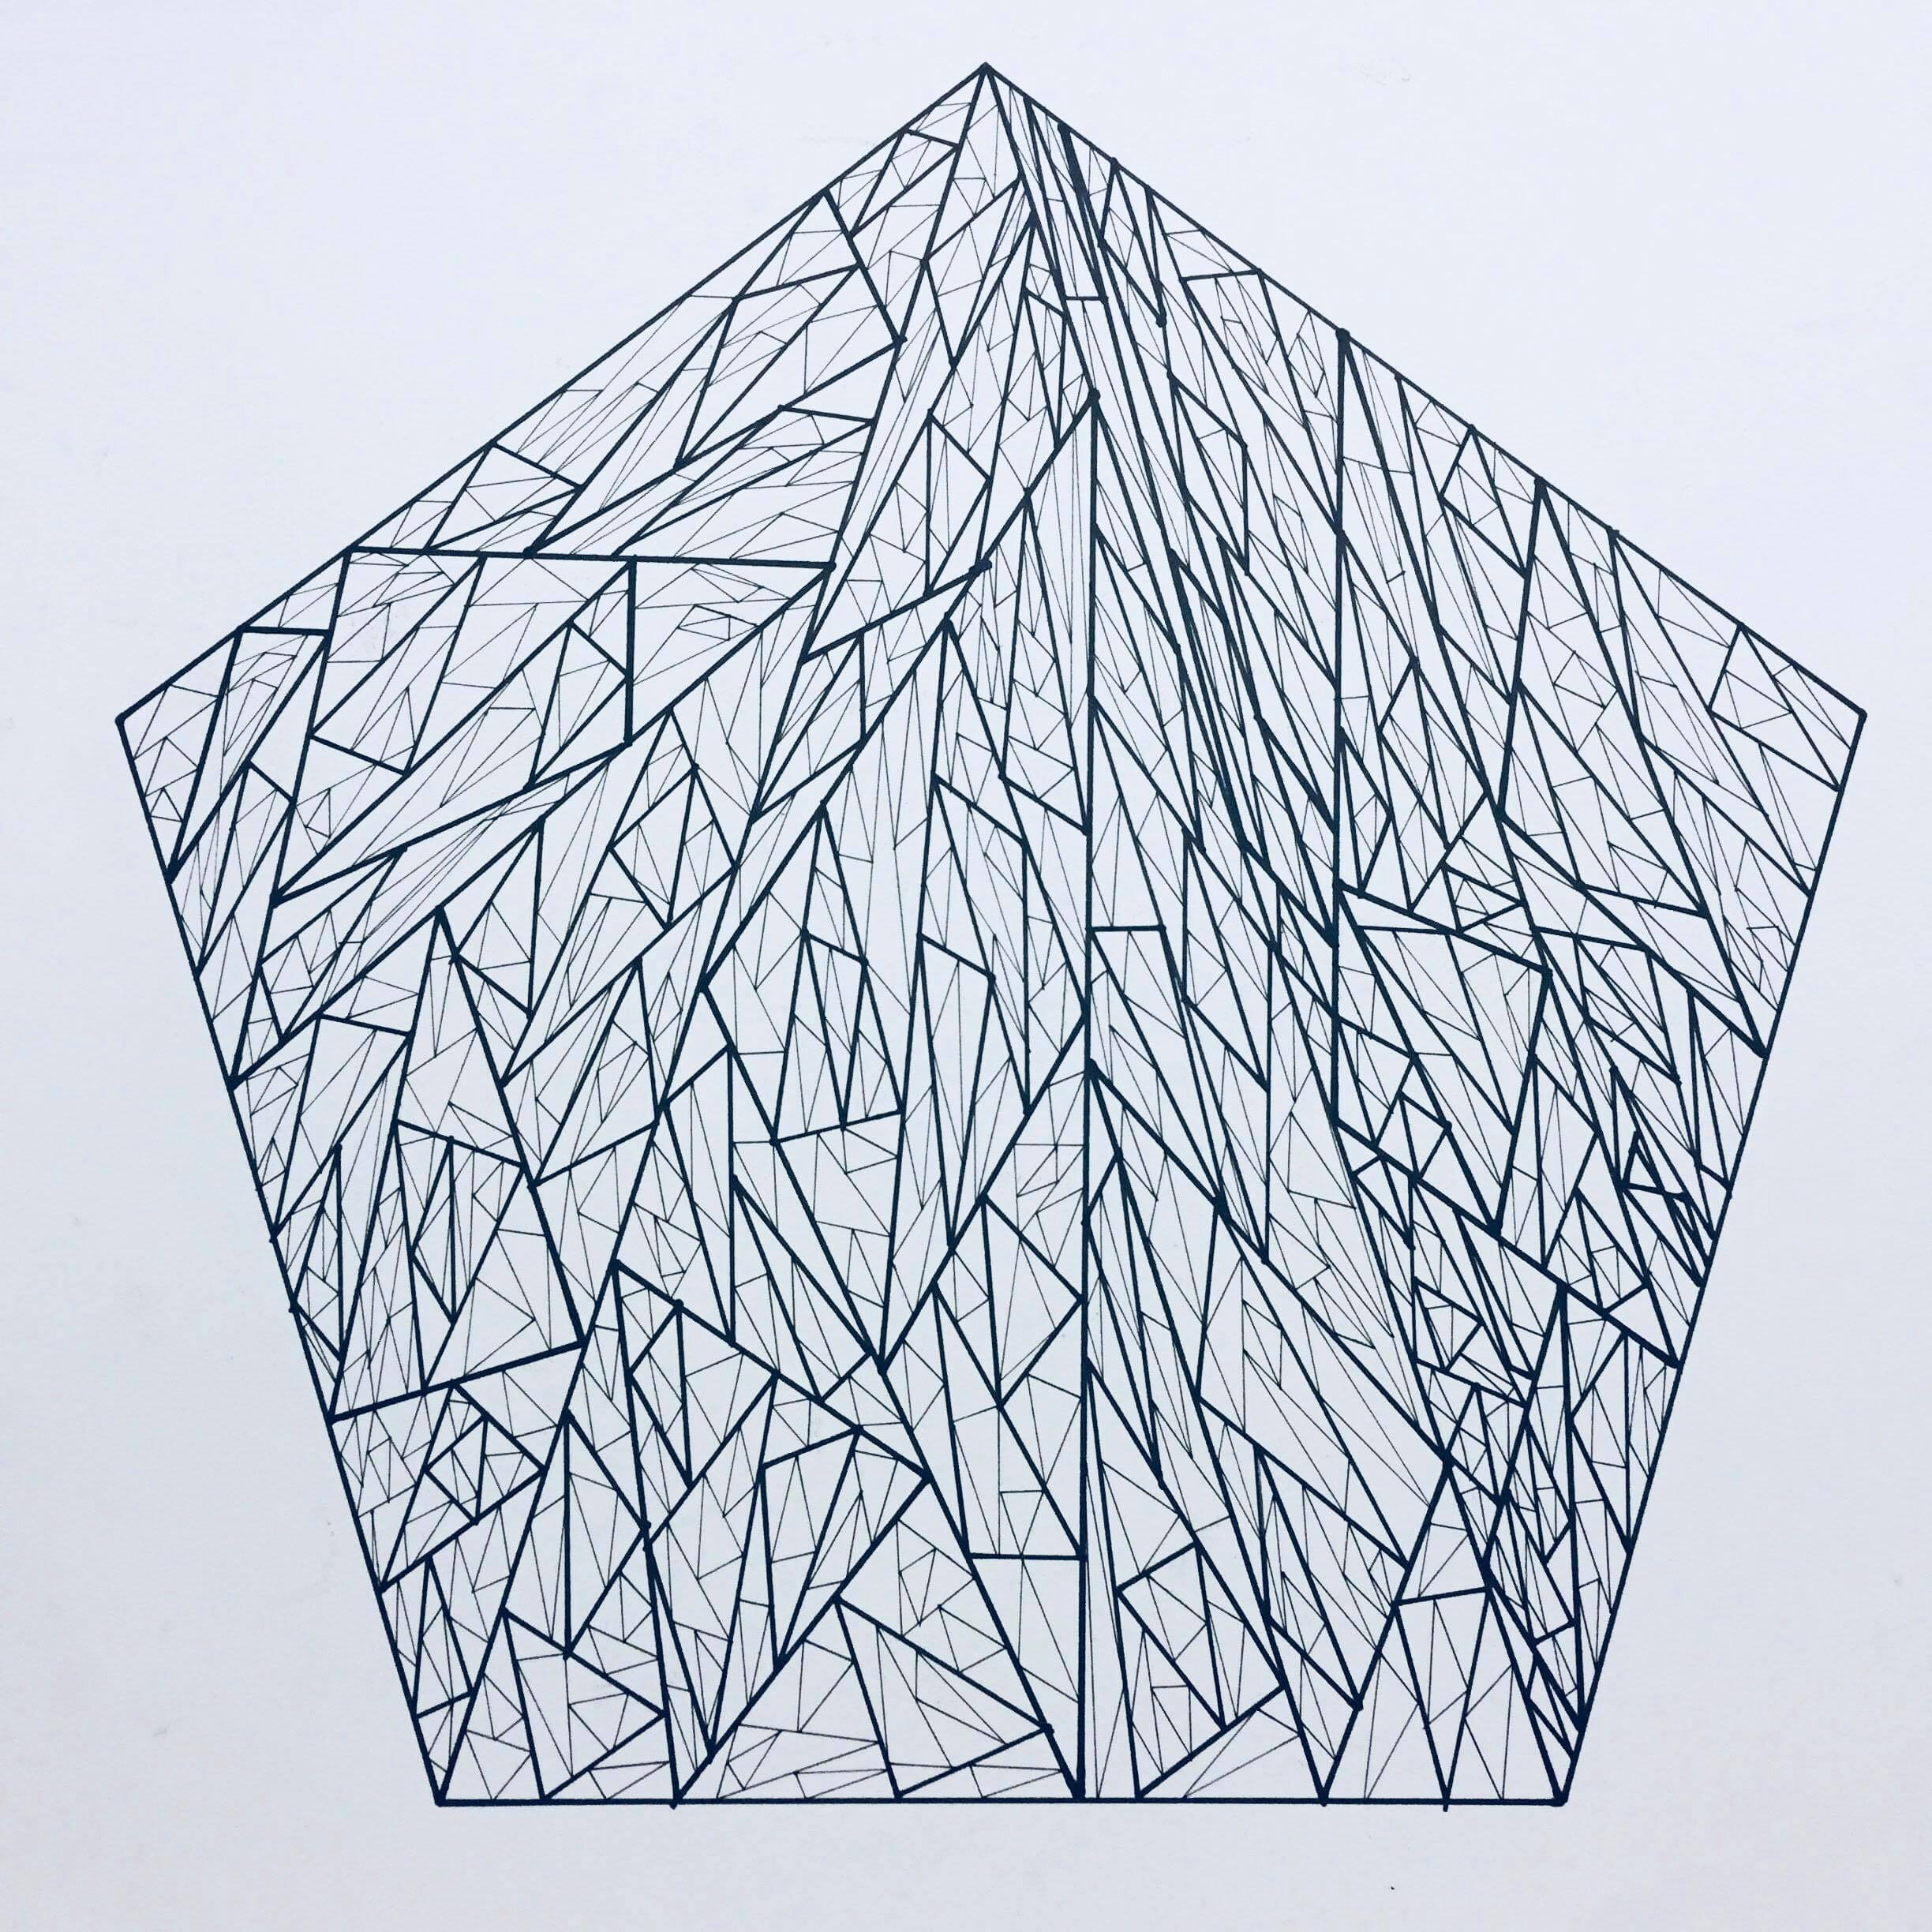
This is one of my favorite project from the Fall 2018 4.021 (Design Studio: How to Design).
We defined our own set of rules for drawing and created three variations by repeating them. My rule was to draw a triangle so that its vertices touch another triangle’s edges. I experimented with uniformity and color in my second variation and shape and line weight in my third variation.
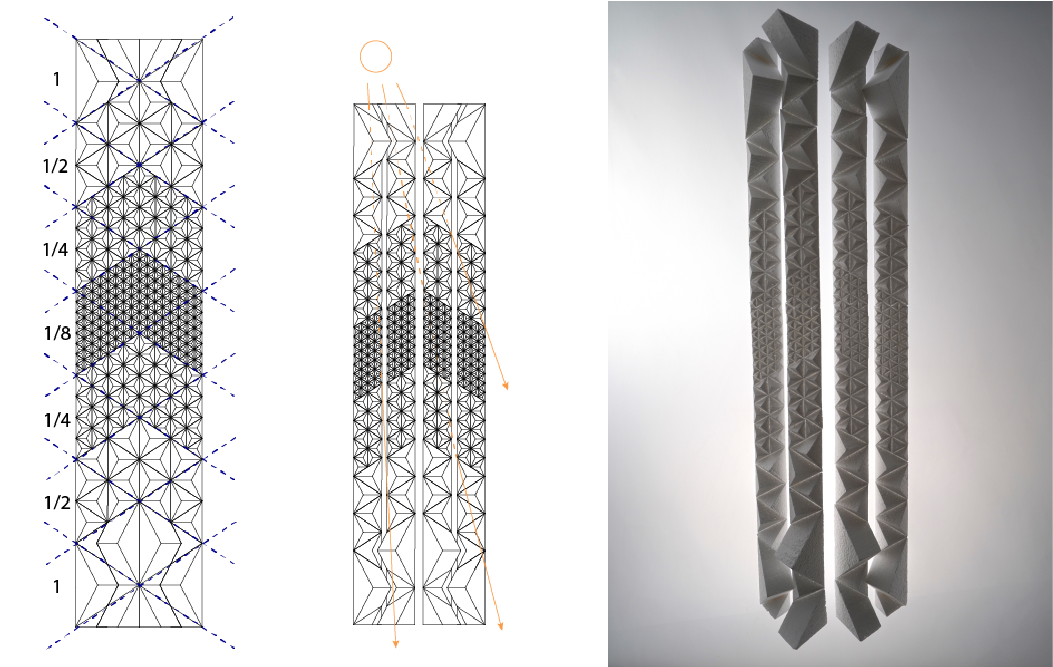
This is one of my favorite project from the Fall 2018 4.021 (Design Studio: How to Design).
We iterated over concept sketches, vector drawings, and prototypes to design window screen panels. My goal was to create window screen panels that allow sunlights through and preserve privacy while exploring triangular surface in scale. I cut each triangle out of foam.
Fun Fact: There are approximately 1000 triangles in my final screen!
← Projects
Browse my boards on
 meowy_ali
Check out my projects on
 alisaono
Connect with me on
 Alisa Ono
Follow me on
 meowy_alisa
Or say hello via
 alisaono.coffee[at gmail]